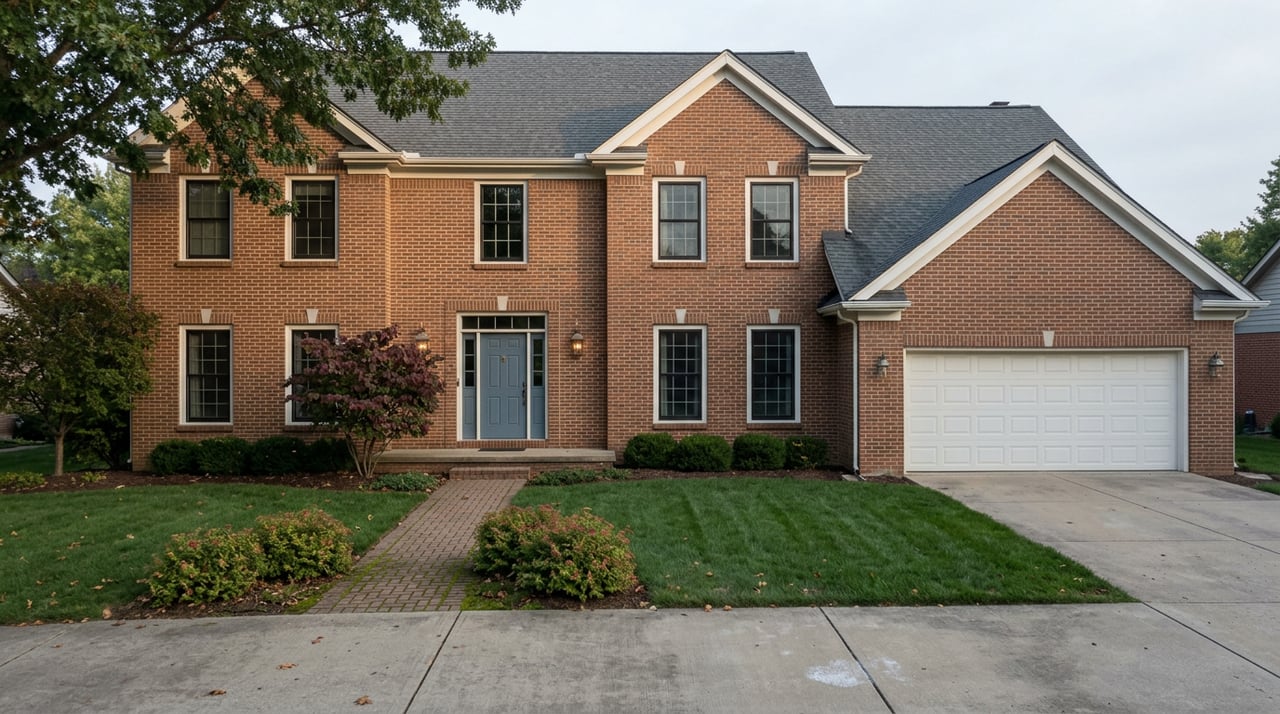
If you've been watching St. Matthews listings and typed some version of "is this a seller's market right now" into a search bar, the honest answer needs two numbers, not one. And the two numbers currently on offer for zip code 40207 don't agree with each other.
As of the first half of August 2026, the median list price for homes in 40207, which covers St. Matthews and the Lower Brownsboro Road area, sat at roughly $409,000, up 7.26 percent from the prior month. That's the number that shows up on a portal search and reads as a hot market. But sitting next to it in the same data set is the average days on market: 55 days. In a market where prices are genuinely outrunning supply, days on market tends to shrink as buyers scramble to beat each other to the next listing. Here it's stretched out even as the asking price climbed. Those two facts, printed side by side, are the story.
What "Median Price" Is Actually Measuring
A rising median list price tells you what sellers currently believe their homes are worth. It says nothing about what buyers have agreed to pay, or how quickly they've agreed to pay it. Days on market is the correction. It measures how long a listing sits before someone signs a contract, which is the closest thing to a real-time read on whether the asking price matches what buyers are willing to move on.
When both numbers rise together, sellers are usually right, and the market is confirming their pricing in real time. When list price climbs and days on market stretches at the same time, sellers are pricing ahead of the demand that's actually showing up. They're anchoring to recent comps, to the appreciation narrative, to what the house down the street sold for eighteen months ago. Buyers, meanwhile, are taking their time, negotiating harder, or simply passing on homes priced at the new ceiling. Fifty-five days isn't a crisis. It's a signal that St. Matthews right now rewards patience more than urgency on both sides of the table.
Why This Matters More in St. Matthews Than It Might Elsewhere
A rising median list price is a survey of what sellers hope. Days on market is a survey of what buyers have already decided.
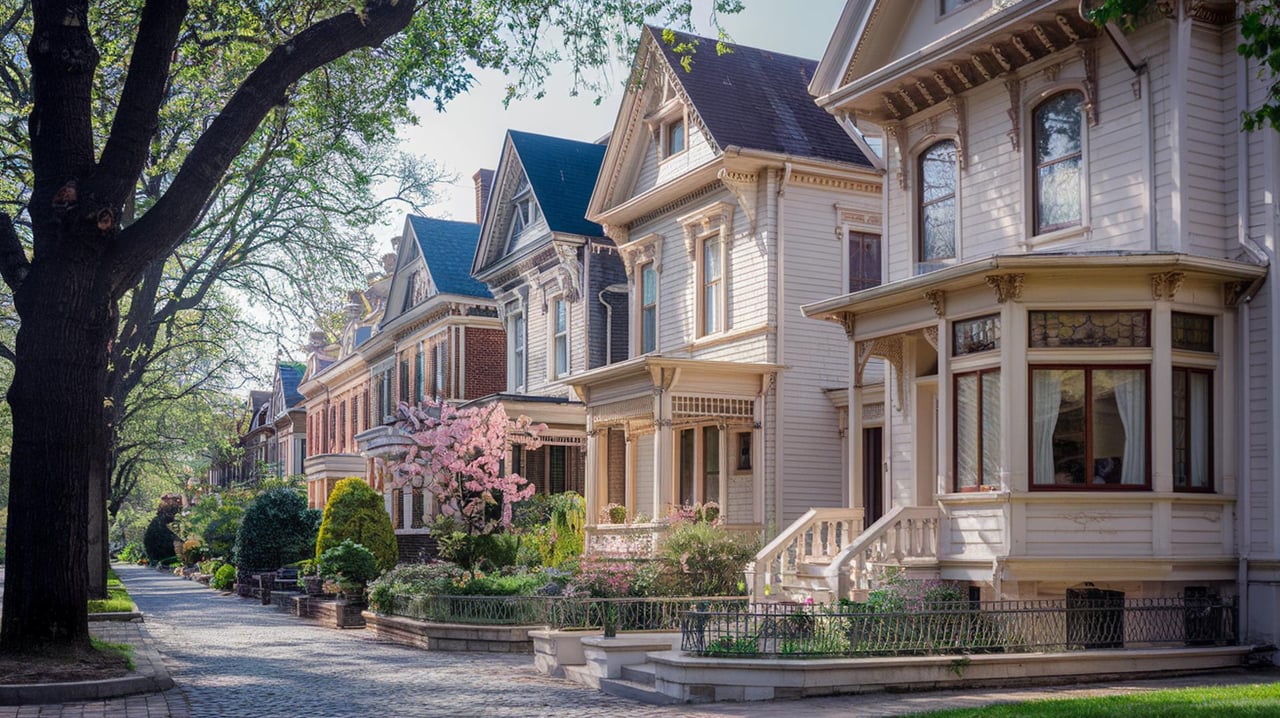
This gap matters more here than in a lot of neighborhoods because St. Matthews doesn't have one housing stock, it has several, stacked inside the same zip code and averaged into a single headline number.
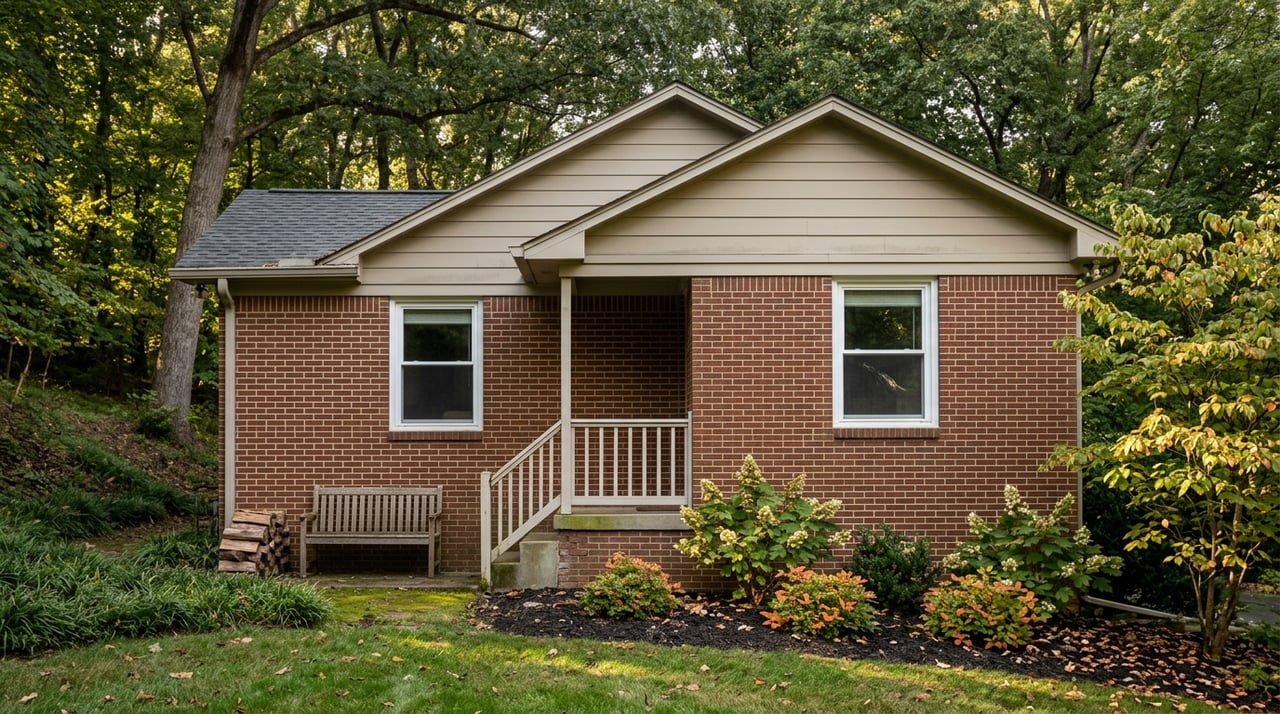
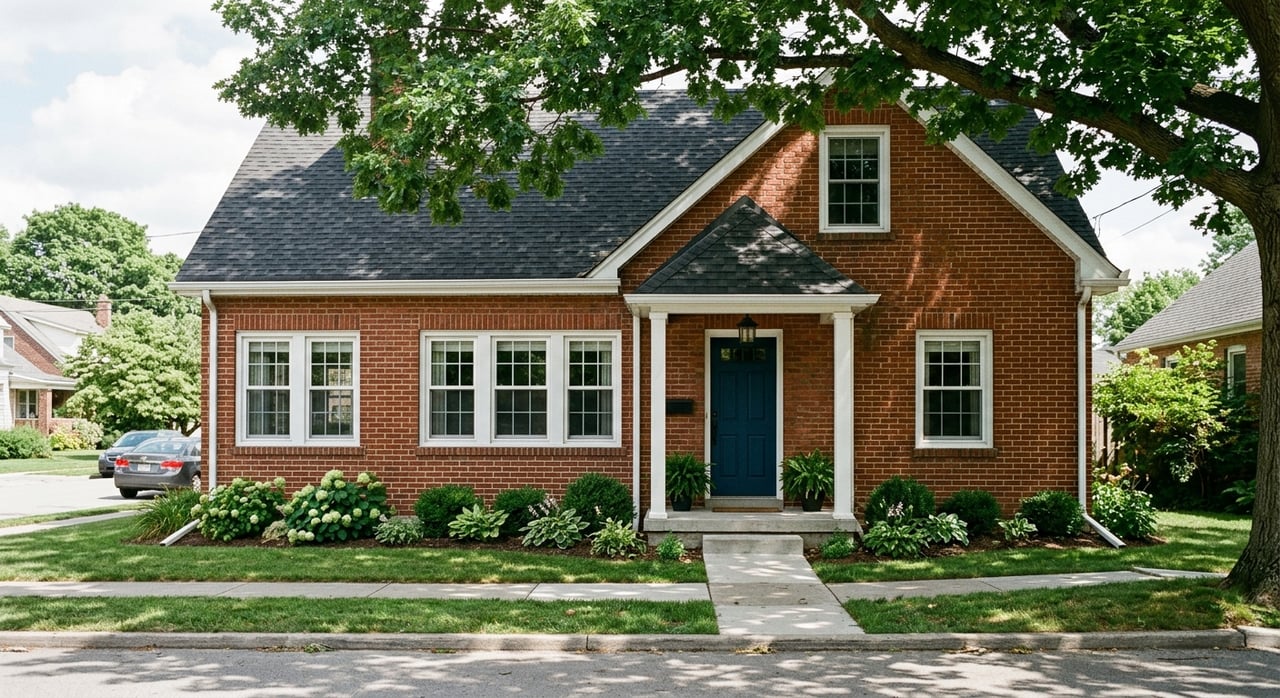
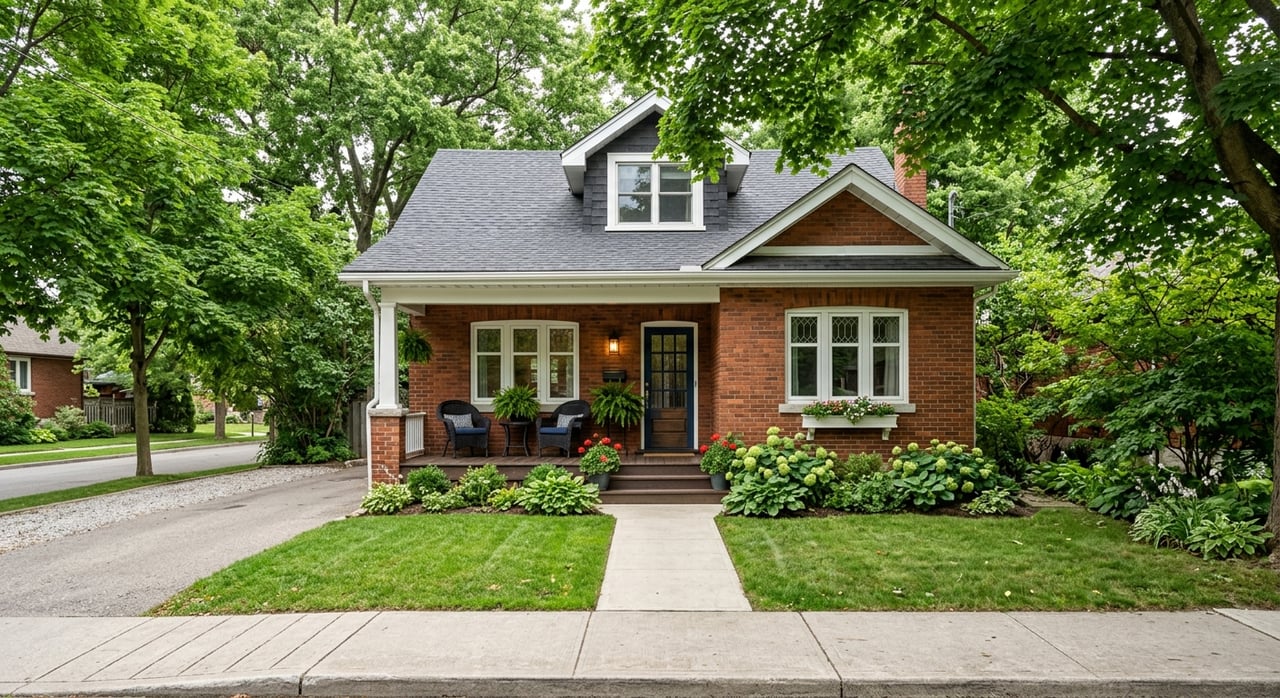
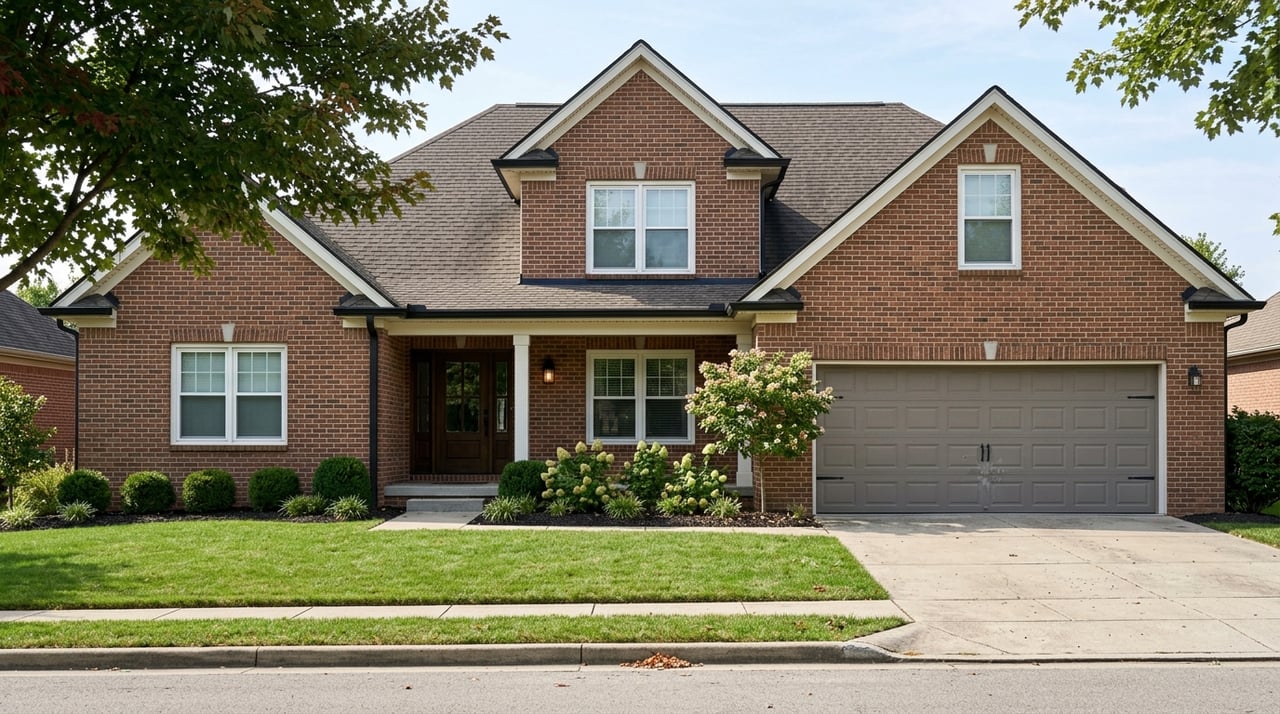
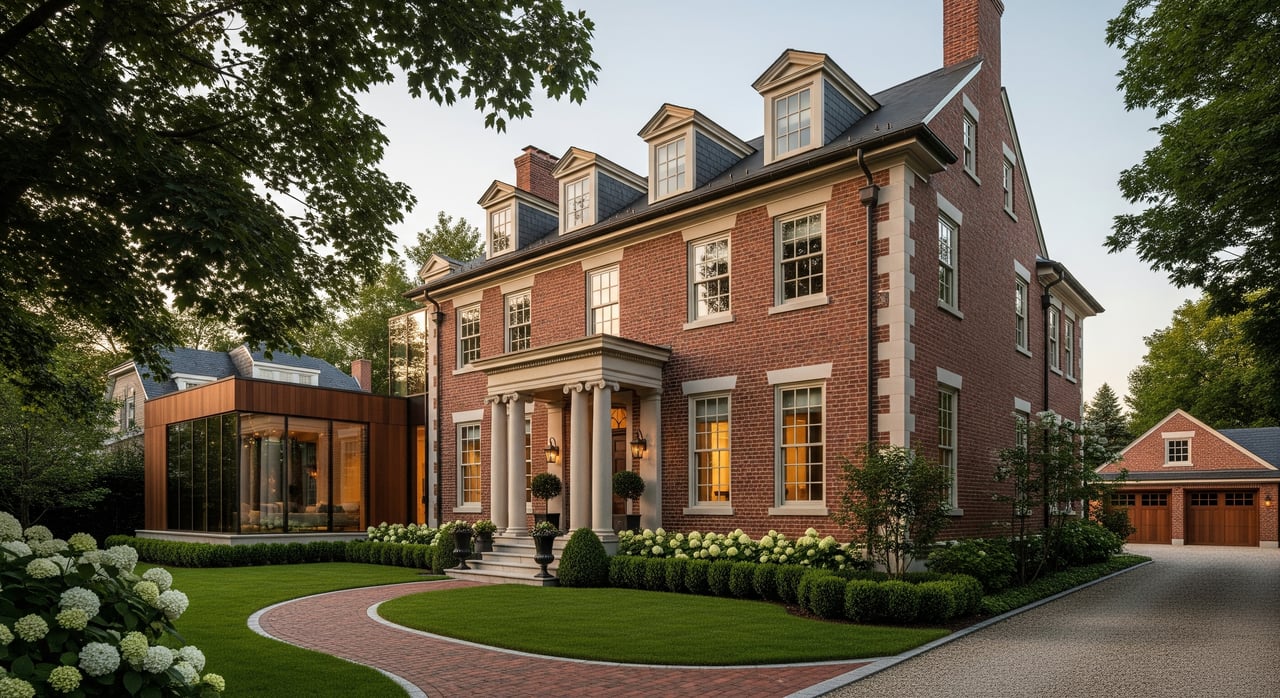
Drive the streets radiating out from the old Point, where Breckinridge Lane, Shelbyville Road, Westport Road, and Chenoweth Lane converge, and you're in the oldest layer of St. Matthews housing: post-war Cape Cod-style homes on streets named for the farming families who once supplied the neighborhood's produce exchange with potatoes for rail shipment. Brown, Rudy, Nanz, Monahan, Oeschner. Those homes were built for a different market and a different era, and they don't renovate or price the same way as the condo and mixed-use product that's gone up closer to Mall St. Matthews and Oxmoor Center. Head toward St. Matthews Station, the site of the neighborhood's first car dealership and now home to tenants like Molly Malone's Irish Pub and Louisville Geek, and you're in a third pocket entirely, shaped by proximity to retail and walkability rather than lot size or vintage.
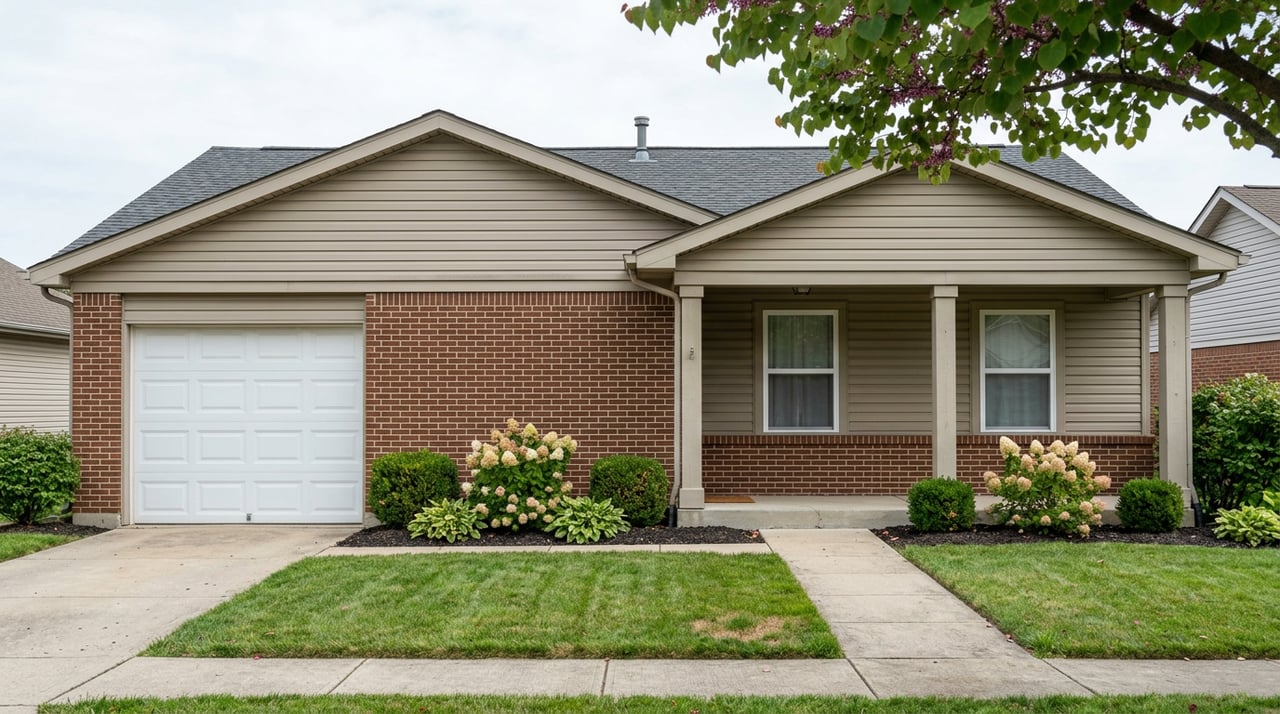
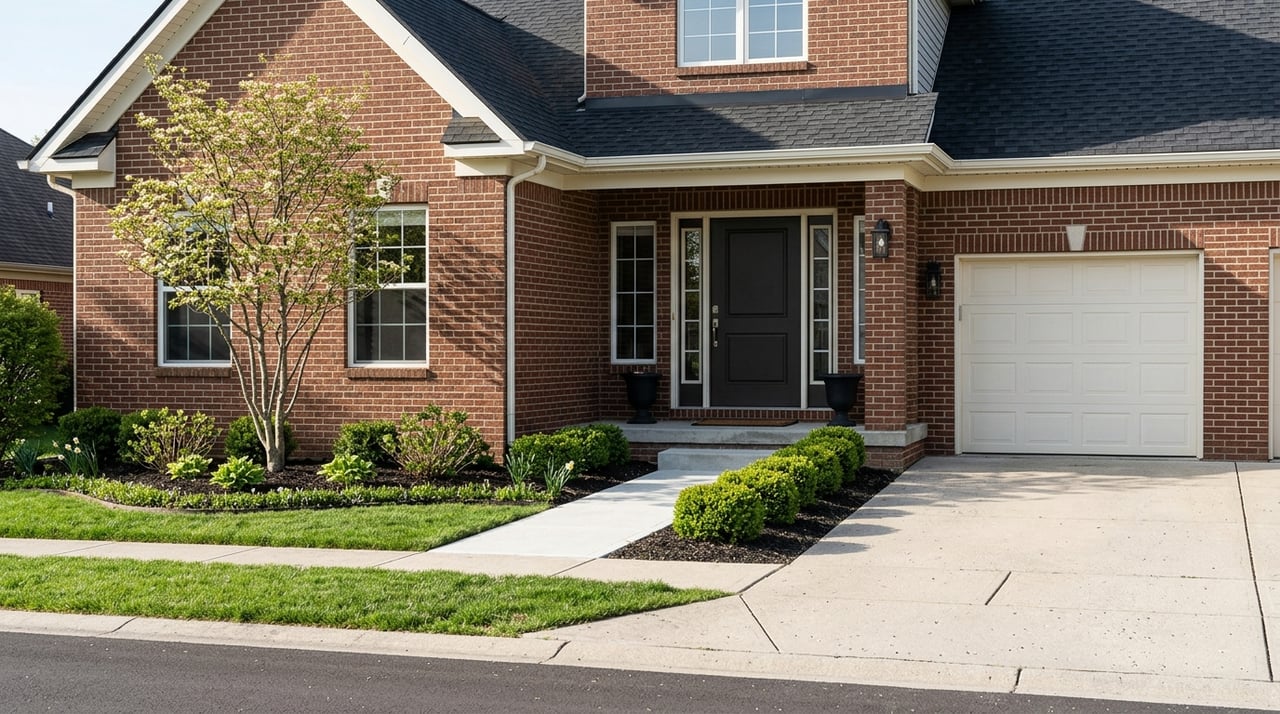
A single median blends a modest three-bedroom Cape Cod half a mile from the mall with a newer build near Seneca Park frontage or a fully updated home a short walk from Trinity High School. The $409,000 figure is real, but it's an average of markets that don't behave identically, which is exactly why the same number can feel accurate to one seller and wildly optimistic to another down the street.
What the Number Actually Buys, Zip by Zip
Here's where the comparison gets useful, and where the fine print matters. The 40207 figure above is a median list price, meaning what's currently asked on active listings. Recent public listing data for the zip codes immediately around St. Matthews report median sales price instead, meaning what buyers actually paid on closed transactions over the trailing year. Those are different measurements, and conflating them is one of the easiest ways to misjudge a neighborhood's actual premium.
With that caveat in place, here's how the picture looks:
| Zip Code | Area | Price Type | Approximate Median |
|---|---|---|---|
| 40207 | St. Matthews, Lower Brownsboro Rd | List price (active) | $409,000 |
| 40205 | The Highlands | Sales price (closed) | $404,063 |
| 40222 | Hurstbourne, Lyndon, Herr Ln, Glenview | Sales price (closed) | $368,589 |
| 40206 | Crescent Hill, Clifton | Sales price (closed) | $294,698 |
St. Matthews' asking prices are running close to what Highlands buyers have actually paid, and noticeably above closed prices in Crescent Hill and Hurstbourne-Lyndon. That's a real premium tied to the neighborhood's shopping access and school proximity. But because one column is hope and the other three are history, the honest read is that St. Matthews sellers are asking Highlands-level money without yet having Highlands-level confirmation that buyers will pay it at that pace. The 55-day average is the gap between the ask and the proof.
What This Means If You're Selling Right Now
If you're preparing to list in St. Matthews and you've anchored your number to that $409,000 headline, ask your agent for the trail behind it: original list price versus final accepted price on the last several closed sales in your specific pocket of the neighborhood, and how many days those homes actually sat before going under contract. A Cape Cod on a farm-family street near The Point and a renovated property near St. Matthews Station can carry very different real absorption times even if they'd both show up under the same zip code average.
Pricing to the median without pricing to your specific sub-market's actual velocity is how a listing ends up sitting past day 55, which then requires a price reduction, which tends to cost more in perception than pricing accurately from the start.
What This Means If You're Buying
If you're comparing St. Matthews to the Highlands, Crescent Hill, or the Hurstbourne-Lyndon corridor, don't stop at the headline medians. Ask what stage of the transaction each number represents. A neighborhood with a lower median sales price and a similar or shorter days-on-market figure might actually be moving faster and pricing more accurately than one with a higher, still-unproven asking price. The 55-day window in St. Matthews also means there's room to negotiate on homes that have been sitting, particularly outside the immediate radius of the mall and The Point where competition thins out.
A Couple of Questions Worth Asking First
Does a rising median list price mean St. Matthews is currently a seller's market? Not on its own. A seller's market shows rising prices alongside shrinking days on market, since buyers are competing hard enough to close the gap quickly. St. Matthews right now shows rising asking prices with a days-on-market figure that hasn't tightened to match, which points to a market still testing where the real ceiling sits rather than one that's confirmed it.
Why does St. Matthews' asking price sit so close to the Highlands' closed price? Both neighborhoods offer walkable retail, mature tree canopy, and strong access to parks and schools, which supports comparable pricing. The difference is that the Highlands figure reflects money that's already changed hands, while the St. Matthews figure reflects what sellers are currently requesting. They may converge. They haven't yet, at least not within the 55-day window the data shows.
If you're trying to figure out what a specific St. Matthews street, or a specific pocket near The Point, Mall St. Matthews, or St. Matthews Station is actually worth right now, based on what's closed rather than what's asked, Gilbert Zaldivar and the ZHomes team can walk you through the real comps, in English or Spanish, before you write an offer or set a list price. Explore current properties or request a home valuation to see where your specific pocket of the neighborhood actually stands.